MENU
STIDS 2016 Home
About--
Topic list
Program Cmte
Local Info
Registration
Program--
Keynotes
Tutorials
Paper Award
Agenda & Papers
Agenda (pdf)
Proceedings
Call for Papers
Important dates
Submission
Class. Session
Download CFP
C4I
Home
|
SEMANTIC
TECHNOLOGY FOR
INTELLIGENCE,
DEFENSE, AND
SECURITY
STIDS 2016
Tutorial
Data Exploration with
Visual SPARQL Queries
Monday, November 14, 2016
Abstract
The freeform nature of Graph style data offers a lot of flexibility for connecting data, but that freedom can also make it more challenging to find interesting patterns or simply navigate through your data. It has become typical for RDF data sets to contain thousands of classes and relationship types, creating challenges to even formulate the analytics and queries you want to perform.
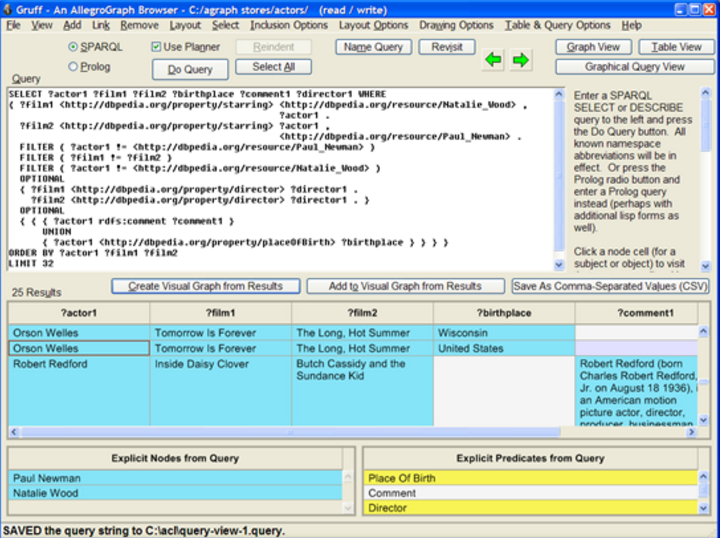
Visual discovery and exploration tools provide a means to make data analyst more effective and the process more efficient. Generating complex SPARQL queries graphically, rather than writing code, offers an onramp to developers learning SPARQL and a means for advanced users visualize complex queries (Fig 1.) where code may be difficult to follow (Fig 2.).
|
Introduction
In this tutorial we will instruct attendees on how to visually explore and query RDF data sets with Gruff, a free downloadable tool. Gruff, a visual analytics and discovery tool, was developed to specifically address the Graph data exploration challenges in large data sets. The tool is used by analysts in the financial world to find connections between their clients and also to discover fraud. Analysts in the pharmaceutical industry use it to visualize and discover connections between drugs, diseases, and cellular pathways. As part of the tutorial introduction we will cover these use cases and offer demonstrations.
During the tutorial we will touch on other visualization tools, such as Linkurious and Gephi, and how they can be used to view the overall structure in your data. We will touch on ideas to use these tools collaboratively with Gruff and best practices for exploring large RDF datasets.
The tutorial will work through the following concepts and attendees will be encouraged to follow along with sample datasets provided or using their own data.
|
Intended Audience
This tutorial is designed for beginner/intermediate technical attendees that would like to become more proficient in SPARQL and data discovery usinga semantic graph database. Advanced SPARQL users will also benefit from the data discovery capabilities that will be demonstrated during the tutorial.
Basic understanding of Graphs, RDF, and SPARQL is helpful but not necessary.
|
|
Schedule
|
| 9:30 - 11:30 |
Exploring Data in the Graph View
|
|
Click for Description
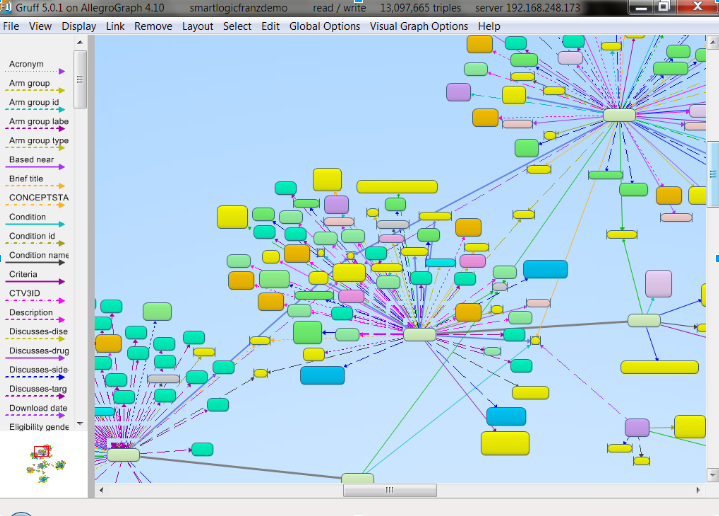
We start the data exploration by viewing the 'network' in the data in a typical graph view (Fig 3). We will demonstrate several network layouts that are useful depending on the type of connections you want to show. Attendees will learn how to explore the nodes in the network step by step or how to select a set of predicates to make the exploration more automatic. In addition, they will learn how to manipulate the labels of the object for more readable graphs and finally we will show how to find the shortest path between any set of nodes.
|
|
| 11:30 - 12:30 |
Lunch |
| |
|
| 12:30 - 14:30 |
Generate SPARQL Queries Directly from the Graph View |
|
Click for Description
Attendees will learn how to generate SPARQL from the Graph view and we will discuss two major use cases where this is beneficial in the data discovery process. In the first use case, an analyst is in discovery mode and is exploring their data in the typical Graph view. While viewing the graph an analyst might see an interesting sub pattern in the graph and wants to know if this pattern occurs more frequently. We will instruct attendees on how to capture this pattern by selecting the nodes in the sub pattern and with the press of a button generate SPARQL query code that can be executed against the data or the SPARQL code viewed for further editing in a query editor (Fig 2).
In the second use case, an Analyst may have a query in mind but does not want to write the SPARQL query by hand or the Analyst is still learning SPARQL and query writing is a developing skill. In this case we will demonstrate how a user would first carefully explore the graph in both a table view (Fig 4) and the graph view (Fig 3) and only select the elements they want to see in the final SPARQL query. Once the analyst has the graph elements on the screen the contents are moved to the query builder view (Fig 1) for SPARQL code generation.
|
|
| 14:30 - 15:00 |
Break
|
|
|
|
| 15:00 - 17:00 |
Modify and Build Visual SPARQL Queries from the Ground Up
|
|
Click for Description
Attendees will learn how to build SPARQL queries completely from scratch using the visual query builder editor. Attendees will learn how to add nodes, links and select predicates. We will cover how to create variables and create filters between nodes and filters on nodes. The ability to add optionals and unions in a query will be discussed and demonstrated. We will instruct attendees on how to execute the visual query, view the results and iteratively edit and refine the query development process using the query builder, table view, and graph view.
|
|
| 17:00 |
Close
|
|
Faculty
Dr. Jans Aasman started his career as an experimental and cognitive psychologist, earning his PhD in cognitive science with a detailed model of car driver behavior. He has spent most of his professional life in telecommunications research, specializing in intelligent user interfaces and applied artificial intelligence projects. From 1995 to 2004, he was also a parttime professor in the Industrial Design department of the Technical University of Delft. Jans is currently the CEO of Franz Inc., the leading supplier of commercial, persistent, and scalable Graph Database products that provide the storage layer for powerful reasoning and ontology modeling capabilities for Cognitive Computing applications.
|

Figure 1

Figure 2
|


